How to recover a known planet in Kepler data?#
This tutorial will demonstrate the basic steps required to recover the signal of Kepler-10b, the first rocky planet that was discovered by Kepler!
Let’s start by downloading the pixel data for this target for one of Kepler’s observing quarters:
[1]:
import lightkurve as lk
tpf = lk.search_targetpixelfile("Kepler-10", author="Kepler", quarter=3, cadence="long").download()
Let’s use the plot method to show the pixel data at one point in time (frame index 100). We’ll also pass along a few plotting arguments.
[2]:
tpf.plot(frame=100, scale='log', show_colorbar=True);
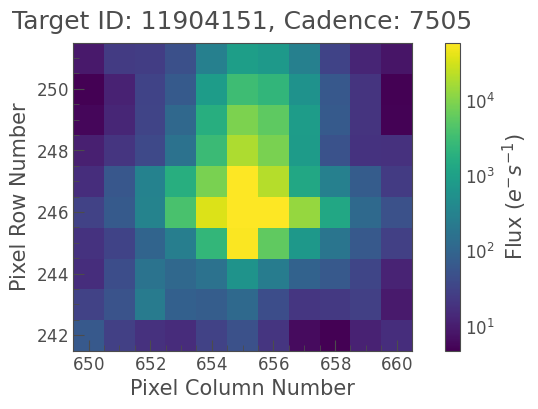
The target pixel file appears to show one bright star with a core brightness of approximately 50,000 electrons/seconds.
Now, we will use the to_lightcurve method to create a simple aperture photometry lightcurve using the mask defined by the pipeline which is stored in tpf.pipeline_mask.
[3]:
lc = tpf.to_lightcurve(aperture_mask=tpf.pipeline_mask)
Let’s take a look at the output lightcurve.
[4]:
lc.plot();
Now let’s use the .flatten() method, which removes long-term variability that we are not interested in using a high-pass filter called Savitzky-Golay.
[5]:
flat, trend = lc.flatten(window_length=301, return_trend=True)
Let’s plot the trend estimated in red:
[6]:
ax = lc.errorbar(label="Kepler-10")                   # plot() returns a matplotlib axes ...
trend.plot(ax=ax, color='red', lw=2, label='Trend');  # which we can pass to the next plot() to use the same axes
and the flat lightcurve:
[7]:
flat.errorbar(label="Kepler-10");
Now, let’s run a period search function using the well-known Box-Least Squares algorithm (BLS), which was added to the AstroPy package in version 3.1.
We will use the BLS algorithm to search a pre-defined grid of transit periods:
[8]:
import numpy as np
periodogram = flat.to_periodogram(method="bls", period=np.arange(0.5, 1.5, 0.001))
periodogram.plot();
It looks like we found a strong signal with a periodicity near 0.8 days!
[9]:
best_fit_period = periodogram.period_at_max_power
print('Best fit period: {:.3f}'.format(best_fit_period))
Best fit period: 0.838 d
[10]:
flat.fold(period=best_fit_period, epoch_time=periodogram.transit_time_at_max_power).errorbar();
We successfully recovered the planet!